Purpose
I wanted to quantify and visualize depencencies of expectancy (the average amount you can expect to win (or lose) per trade, when a large number of trades are taken) from stop, traget and spread & commissions. Written with currency pairs in mind but applies to other assets, too.
Random Walk Example
An example to get started:
- spread \(c = 1\) pip; commissions are zero
- assume that ask = bid + c always
- a long position is opened and held until either stop or traget is hit
- stop is hit when bid drops \(s = 20\) pips down;
- target is hit when bid climbs \(t = 10\) pips up (and ask is then even higher, namely, \(c\) pips higher)
Each win is then \(W = t - c = 9\) pips, each loss \(L = s + c = 21\) pips.
If price is a random walk, then the loss probability is \[l_{rw} = {t \over t+s} = {10 \over {10 + 20}} = {1 \over 3}\] Win probability is \[w_{rw} = 1 - l_{rw} = {s \over {t + s}} = {2 \over 3}\]
The expectancy is \[E = W \cdot w_{rw} - L \cdot l_{rw} = 9 \cdot {2 \over 3} - 21 \cdot {1 \over 3} = -1 = -c\] You loose one spread per trade, on average. This holds for any combination of stop and target.
Introducing Edge
Let's consider the edge \(x\) and call it a percentage (a fraction, strictly speaking) of loosing trades you are able to prevent. E.g., the edge \(x=0.1\) means that every tenth looser is prevented (by not opening the position). The loss probability becomes lower: \[ l = (1-x) \cdot {t \over {t + s}} = {9 \over 10} \cdot {1 \over 3} = 0.3 \] vs ⅓ before. The expectancy becomes higher: \[ 9 \cdot (1 - 0.3) - 21 \cdot 0.3 = 0 \] i.e. break-even in this example.
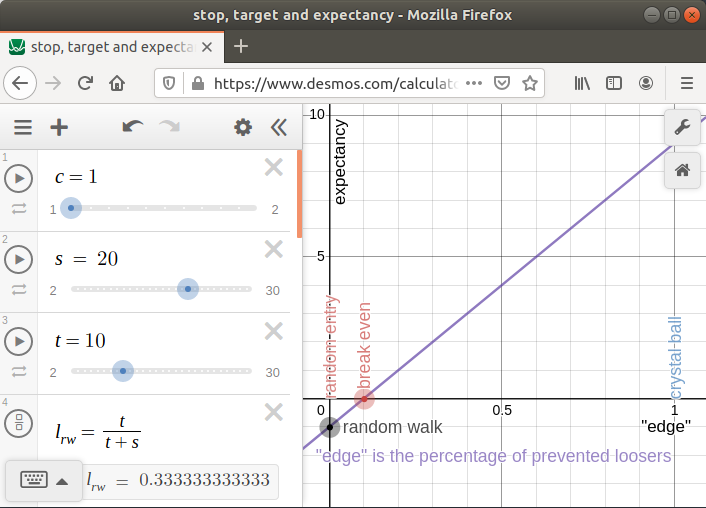
Play with it
You can play with sliders for spread, stop and target in desmos graph calculator and see what happens to expectancy, e.g. how considerably spread cuts into target and decreases the win when target is small. Click on the image below to get straight to the example.
Another (extereme) example: if target \(t = 2 \cdot c\) is only twice the spread (in this example, the bid needs to clibmb two pips, not the ask), then every second looser needs to be prevented by having an edge, just to become break-even. It gets worse when spread increases (slider "c").
The further the target (slider "t", how many pips the bid needs to go up), the smaller fraction of loosers prevented is enough to become break-even (but the more difficult this becomes to achive: the further the target, the more likely the stop is hit first).
Nothing seemeingly happens on the graph when stop distance changes (slider "s"). The same fraction of loosers prevented is needed to become break-even. However, the further the stop, the more seldom this prevention is required; On the other hand, when the stop is hit, the loss is bigger, too, and the equity curve will look differently (less smooth, the system scales up worse).
Comments and Suggestions
Appreciated via github issue tracker or futures.io.